pysteps.visualization.motionfields.streamplot#
- pysteps.visualization.motionfields.streamplot(uv_motion_field, ax=None, geodata=None, axis='on', streamplot_kwargs=None, map_kwargs=None, step=20)#
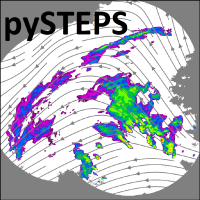
Function to plot a motion field as streamlines. Wrapper for
pysteps.visualization.motionfields.motion_plot()passing plot_type=”streamplot”.- Parameters:
uv_motion_field (array-like) – Array of shape (2, m,n) containing the input motion field.
streamplot_kwargs (dict, optional) – Optional dictionary containing keyword arguments for the quiver method. This argument is passed to See the streamplot_doc matplotlib’s documentation.
:param See
pysteps.visualization.motionfields.motion_plot().:- Returns:
out – Figure axes. Needed if one wants to add e.g. text inside the plot.
- Return type:
axis object
