pysteps.visualization.motionfields.motion_plot#
- pysteps.visualization.motionfields.motion_plot(uv_motion_field, plot_type='quiver', ax=None, geodata=None, axis='on', plot_kwargs=None, map_kwargs=None, step=20)#
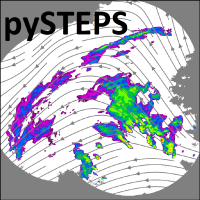
Function to plot a motion field as arrows (quiver) or as stream lines (streamplot).
- Parameters:
uv_motion_field (array-like) – Array of shape (2,m,n) containing the input motion field.
plot_type (str) – Plot type. “quiver” or “streamplot”.
ax (axis object) – Optional axis object to use for plotting.
geodata (dictionary or None) –
Optional dictionary containing geographical information about the field.
If geodata is not None, it must contain the following key-value pairs:
Key
Value
projection
PROJ.4-compatible projection definition
x1
x-coordinate of the lower-left corner of the data raster
y1
y-coordinate of the lower-left corner of the data raster
x2
x-coordinate of the upper-right corner of the data raster
y2
y-coordinate of the upper-right corner of the data raster
yorigin
a string specifying the location of the first element in the data raster w.r.t. y-axis: ‘upper’ = upper border, ‘lower’ = lower border
axis ({'off','on'}, optional) – Whether to turn off or on the x and y axis.
step (int) – Optional resample step to control the density of the arrows.
plot_kwargs (dict, optional) – Optional dictionary containing keyword arguments passed to quiver() or streamplot. For more information, see the quiver_doc and streamplot_doc matplotlib’s documentation.
map_kwargs (dict) – Optional parameters that need to be passed to
pysteps.visualization.basemaps.plot_geography().
- Returns:
out – Figure axes. Needed if one wants to add e.g. text inside the plot.
- Return type:
axis object
